- Of SmartsheetDashboardIt is an experience corner to have the image of.
- The dashboard is Project status,Key Performance Indicator (KPI) And so on together with the people concernedGraphIt can be shared visually using such as.
- Also, to sheets and related sitesShortcut,レポートDisplay frequently used resources together, and even moretext,imageBy addingIn the form of a homepageIt can also be provided.
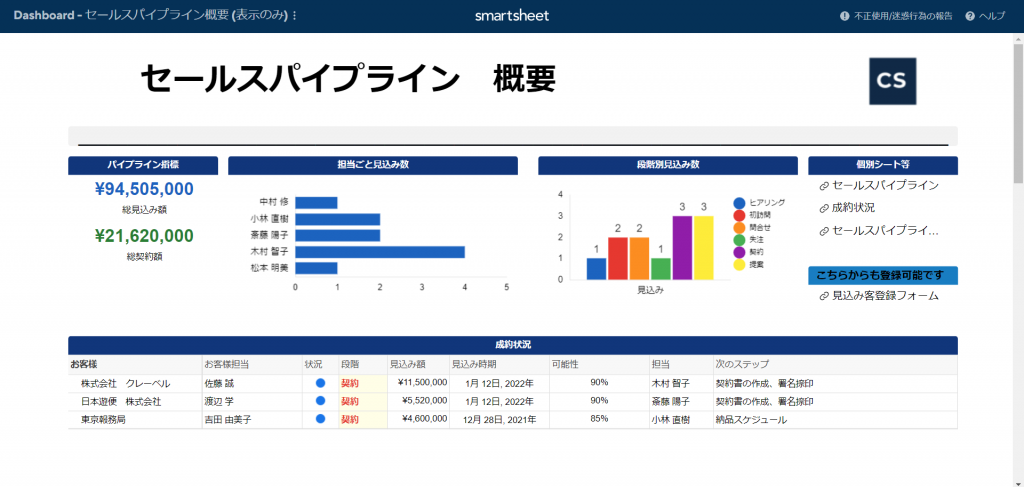
Sales pipeline example
- TypicalSales pipelineIt is a dashboard of.
- You can check the base sheet etc. from the "Individual sheet etc." link.
- Data from the sheets are visually represented in the dashboard.
- You can also register prospects on the dashboard or via the link's form and see it reflected in the dashboard.
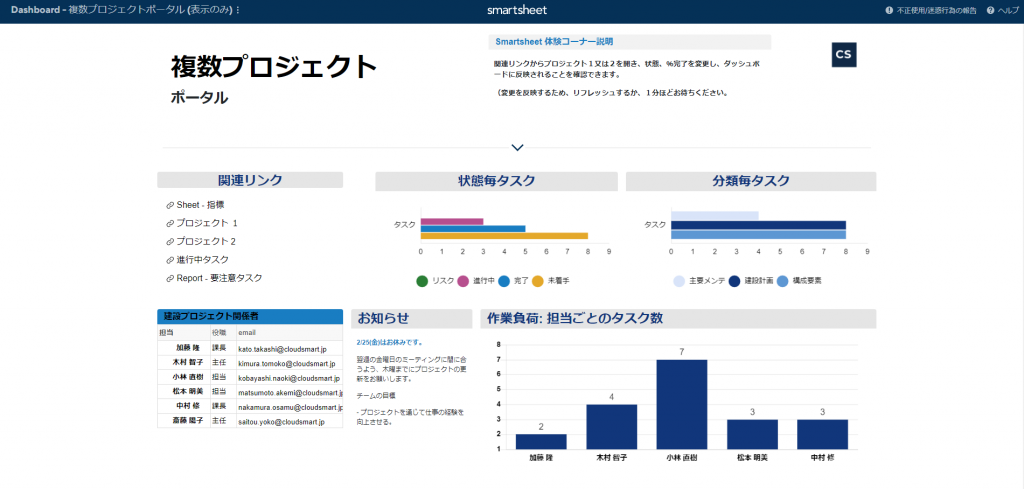
Examples of multiple construction projects
- An example of a dashboard for multiple projects in areas such as construction and equipment.
- The Gantt chart of the original project is "Related LinksYou can check it from.
- Also, on the dashboard, ["GraphThe data that is the source of "" is "Indicator", and you can also check the report that is the source of the task that needs attention while it is in progress from "Related Link".
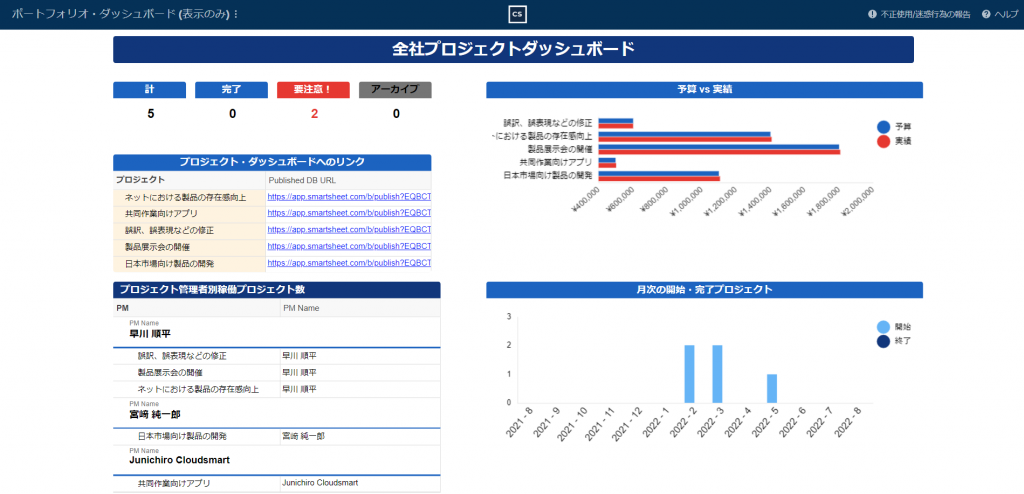
★ Example of company-wide project management ★
- For the entire organizationDozens or hundreds of projectsThis is an example assuming a usage example unique to Smartsheet that manages.
- eachA bird's-eye view of the dashboard for each project with the dashboard for the entire companyWe have a high level of management.
- Like this example, SmartsheetControl centerUsing the features of, a project consisting of XNUMX Smartsheet contents such as sheets, reports, dashboards, etc. will be generated almost automatically.
- It is made with the setting of managing XNUMX projects assuming the expansion of the product in the Japanese market for demonstration.
- Individual projects are "Link to the project dashboardYou can check it from.
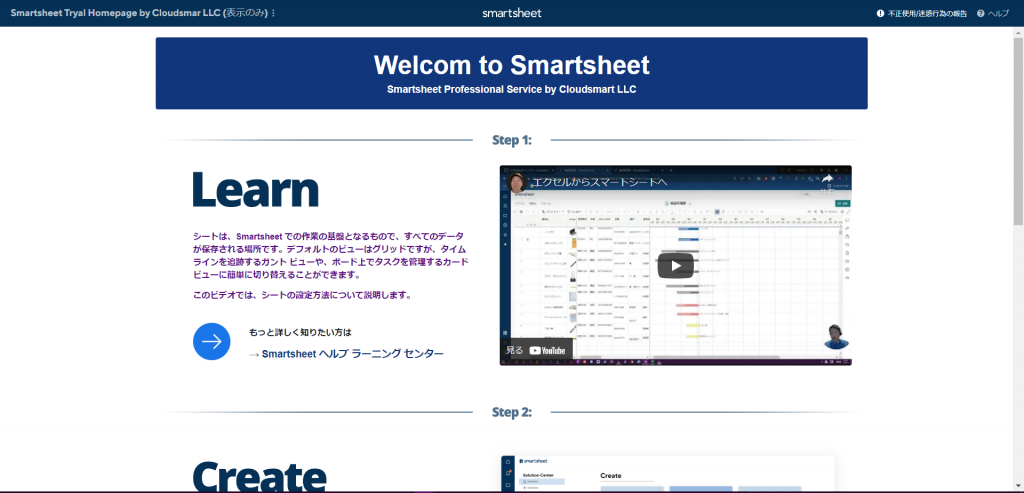
Home page example
- This is an example of using the dashboard as a home page.
- In addition to Smartsheet content, images, documents, videos, etc.Embed various contents with widgets
- You can easily create in-house or team web pages with the Smartsheet dashboard.
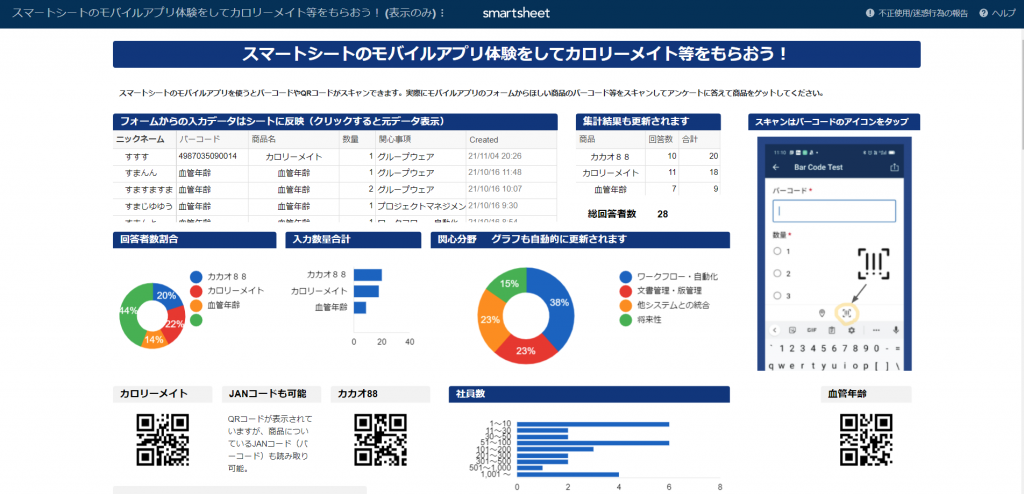
Demo example at an event
- Of smart seats at the eventMobile appThis is an example assuming that the function of is demonstrated on the dashboard.
- Similar to the example on the homepage, various contents such as QR code images are pasted using widgets.
- You can open the form in the mobile app from the QR code and see the result displayed in the graph.
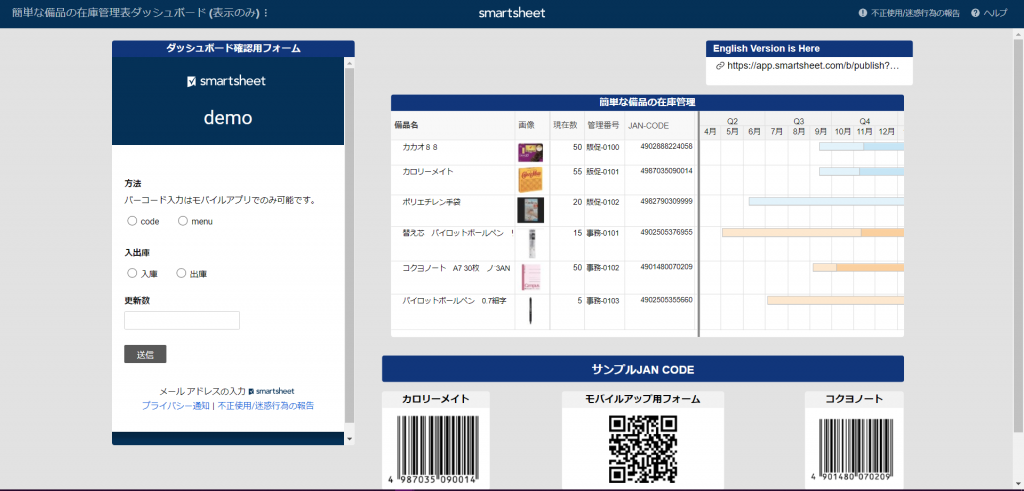
Simple inventory management example
- workshopBut here is an example of simple inventory management using Smartsheet.
- The workshop focused on explaining business logic, including cross-sheet functions that aggregate and reference information across multiple sheets for inventory control.
- The dashboard is designed so that users can experience the contents of the workshop by displaying a form or pasting an image such as a QR code so that the input result can be confirmed in the same way as for the event demo.
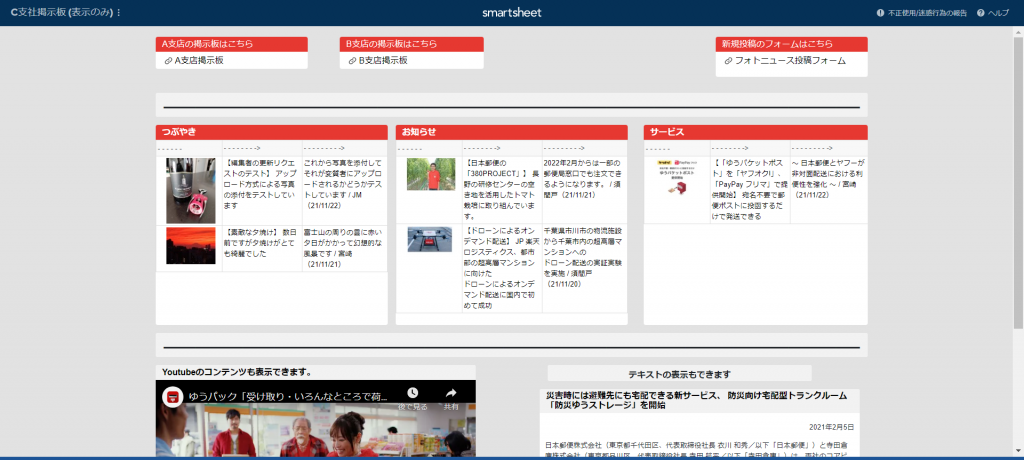
Bulletin board example
- This is an example of an in-house bulletin board.
- Have the form submitted and sent to the editorUpdate requestTherefore, it is set that the editor confirms the content and performs the posting procedure.
- The photo was attached by the poster as an attachment by the editor.Paste the image in the cell, Is taken.
- You can submit through the form, but it will take some time to reflect due to the above procedures.
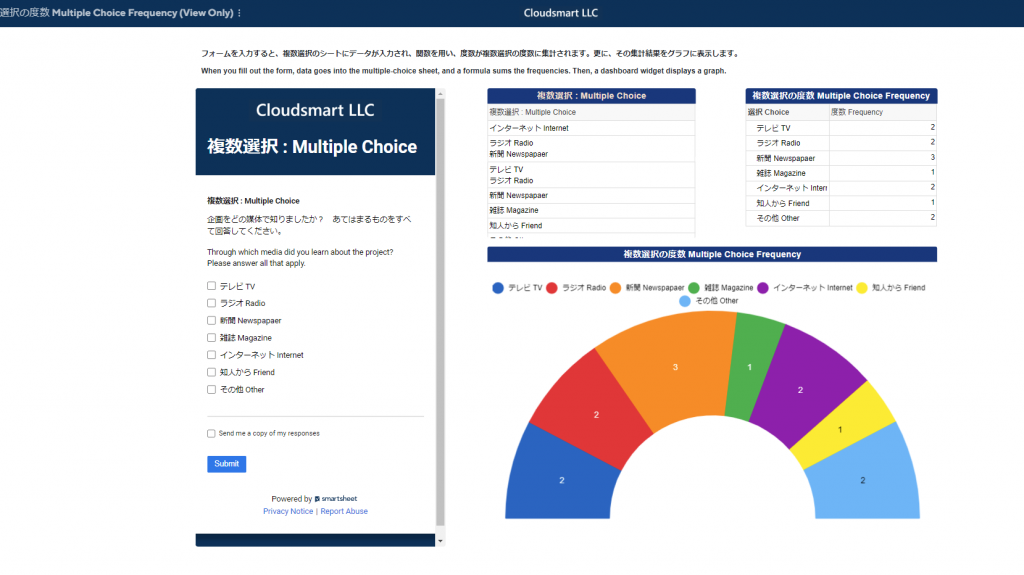
Aggregating multiple-choice surveys
- This is an example of asking multiple-choice questionnaires to be entered in a form, counting the frequencies and graphing them with functions.
- The function used for frequency aggregation is rather advanced.
For details, please refer to the help article link for each function.