first
In Smartsheet's help article, dashboards are positioned for advanced users on the learning track, but using widgets is not that difficult, and I think it should be positioned more for intermediate users.
This article is for advanced users, so rather than the basics of how to make a dashboard, detailed design and operability tips,How to efficiently control the display content by setting the viewer mode of widgets and report-type widgets*Focus on and add a description.
(*Report widget: In this article,Viewer modecan be setreport widgetandChart widget with report as data sourceis abbreviated for report widgets. )
Related content
For information on what the dashboard looks like, see "Smartsheet dashboard experience."
Also, how to create a dashboard for project management, see "Project Management Dashboard (Workshop 4)."
Dashboard viewers do not need permissions to underlying sheets
Unlike reports, viewers do not need access to the underlying sheets to view information in a dashboard.
Therefore, the Metrics, Report, and Charts widgets can be used to selectively display specific information from sheets in dashboards without granting access to the underlying sheets.
Sheet information display methods and display controls
There are several ways to display sheet information in the dashboard.
and which widget to use, andreport widget(with report as data source)chart widget(includingViewer mode, the range of displayed data varies.
This feature, when used wisely, enables efficient information display control according to the viewer's rights on the original sheet.

Data in the sheet itself: Metrics Chart Widget
When you use the Metrics Widget and Chart Widget methods to display sheet data without going through a report, the information is always displayed regardless of the permissions for the underlying sheet.
Sheet data via reports: Report widgets
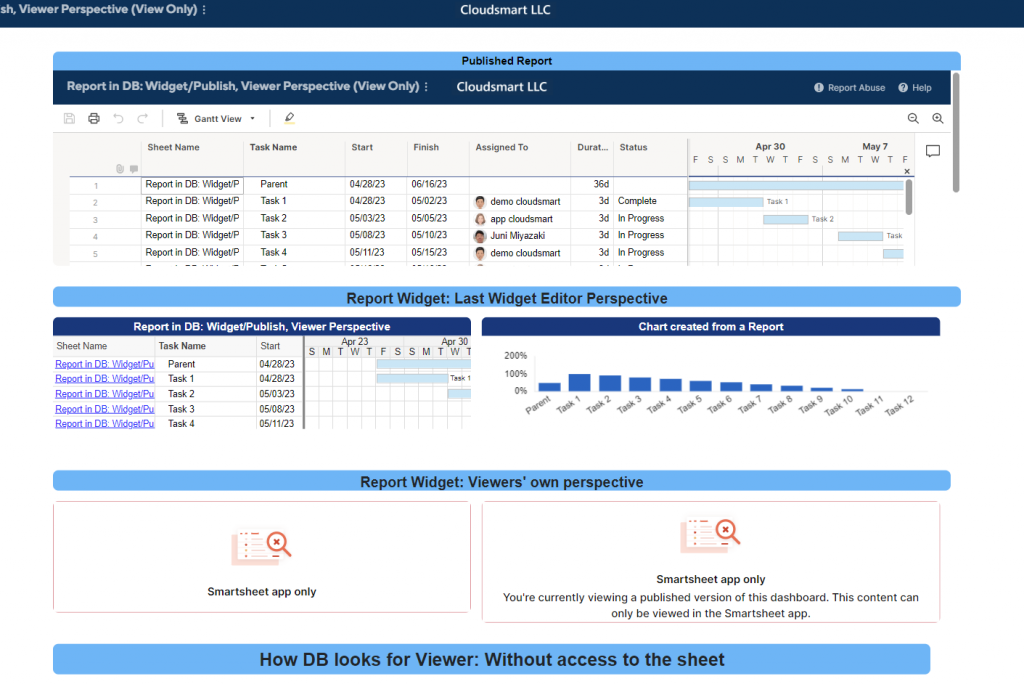
If you want to view the sheet's data via a report,Viewer modeTheFinal editor's point of viewOrUser's unique perspectiveYou can control the content of the displayed data by setting the
Of the dashboardLast editor's point of view → Always visible regardless of permissions
If you select Last Widget Editor in the Reader Mode section, it will always be displayed according to the Last Widget Editor's visibility settings regardless of the permissions on the underlying sheet.
Apply current user's filter as last editor
Note that if you use the Current User filter in your report, the last editor will be the current user.
User's unique perspective → Display/hide depending on the access authority to the sheet
In the Reader Mode section,User's unique perspectiveIf you select , what you see depends on your permissions to the underlying sheet.
current userfilters are unique to the viewing user
Use this option if you only want the report to display data from sheets accessible to the person viewing the dashboard.Anyone viewing the data must have been shared with the sheet the report was created from.If the original report has a "Current User" filter applied, the dashboard viewer will only see rows where that report has that dashboard viewer in the "Contact" column.
Commonly used for displaying My Tasks, etc.
For example, if the original report is based on project management and task management sheets, the assignee filtercurrent user, in the dashboardlogged in userYou can display only tasks such as .
For example, on your team's dashboard, separate from the team-common section:My task, etc. can now be effectively displayed using the user's filter.
in another articleHow to view login user information on the dashboard” uses this method.
How to display public sheets and reports with web widgets → Always display regardless of permissions
When a sheet or report is published and displayed on a web widget, it will be displayed regardless of the authority to the original sheet.
Unlike viewing via the report widget, all information on the sheet will be displayed, but you can select read only, editable, etc. in the publishing options. It is possible to display the entire sheet. (There are differences in how it looks, such as the logo displayed in the title and the photo of the assignee's face.)
Dashboard reports do not require sheet permissions
upper"Sheet data via reports: Report widgets","View of last editor on dashboard → always visible regardless of permissions”, but I will explain it again because it is a highly practical function.
Single report requires permission to sheet
A common concern that customers have about reports is, "I want to show only specific information on the sheet to the people involved in the report, but I need to give permission to the sheet in the report, so I can see information that I don't want the people involved to see. I'm in trouble."
If you use a dashboard, you can let stakeholders view the information narrowed down by the report without giving permission to the sheet.
In such cases, you can display the report in your dashboard using the Report Widget, or display the published report using the WEB Widget so that you can narrow it down to the stakeholders without granting permissions to the underlying sheets. I can show you the information.
For example, in a sheet with a Gantt chart of the progress of housing construction, you want to make the Gantt chart visible to all the people involved, but the sheet may contain budget information, evaluation information, and other information that is not desirable to share. .
In such cases, by narrowing down only the information necessary for displaying the Gantt chart in the report and pasting the report widget or public report with the web widget, it is possible to provide only the necessary progress information to the relevant parties by sharing the dashboard. can.
The following is the same as the official help article.
Official commentary video
Create and Modify Smartsheet Dashboards
Dashboards are communication tools that give you real-time visibility into important data and aggregating all the information your team needs in one place.
Dashboards consist of easily configurable widgets, the basic elements of dashboards, that can display live data in sheets and reports.Dashboards can be shared with anyone - his team members, executives, external customers - and easily viewed on desktop or in his Smartsheet mobile app.
By sharing live dashboards with various stakeholders, you can get the right information to the right people at the right time to make informed decisions.It can also be used as a team portal to centralize all information and resources about programs, processes and teams in one place.
Required permissions
Let's start creating and modifying dashboards.
License owners and administrators can create or edit dashboards.Viewers can see the dashboard.
Adding data to charts, metrics, and report widgets requires sharing permissions on the source sheet or report.
Create a new dashboard
- On the left side of the screenNavigation barso,[Solution Center] Click the (plus) icon.
- in the left panel,[create] Click and[Dashboard/Portal] Select a tile.
- Enter a name for your dashboard,[OK] Click.A new blank dashboard will appear.
- The top right pencil iconto edit the dashboard by clicking or from the edit menu Edit Dashboard to start adding information to your dashboard.For information on widget types and how to configure them, seedashboard widget .
- Widgets can also be resized and repositioned after creation:
- To move the widget to a new location, click and drag it to the new location or cut/paste.
- To resize a widget, drag its bottom right corner.
- top right of dashboard [keep] Click to save your changes.
Make changes to your dashboard
in the upper left,[Dashboard Settings] or sending us a message on [Add Widget] Click.Detail is,"Add and edit widgets on your dashboard"Please refer to the.Detail is,"Add and edit widgets on your dashboard."
Adjust the dashboard background color
When you have a dashboard open in Smartsheet, you can set the background color of that dashboard to gray or white.
To change the dashboard background color
- top left of dashboard [edit] Click Menu.
- [Dashboard Settings] Click.Alternatively, right-click the background grid and select[Dashboard Settings] on the right when in edit mode.function bar, select the gear icon.
- Select a background color and click Save to confirm your changes.
Applying custom colors
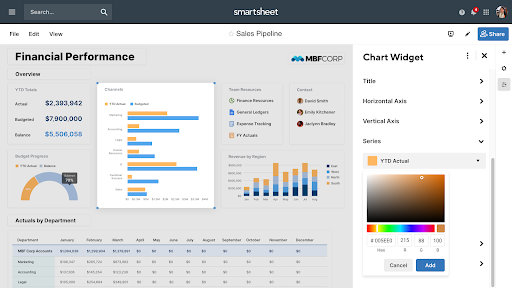
When choosing colors for fonts, charts, titles, and more, you can choose from standard presets or add custom colors using HEX codes, RGB codes, or color gradients.To create your own custom color, click on the color selector [Custom Color] Is under [+] Select an icon.
Dashboards store up to 20 custom colors, so if you add a custom color to Widget A, you can quickly select the same custom color for Widget B if those widgets are on the same dashboard.
Custom colors are specific to the dashboard you are editing and will not appear on other dashboards.

When viewing the dashboard in the mobile app, the custom colors will be replaced with the closest default color available.
Set how often you want your dashboard to refresh automatically
By default, the dashboard automatically refreshes with the latest information every 10 minutes.
To change the frequency or disable automatic updates:
- in the upper left [display] Click.
- [Automatic updating] Hover over .
- Choose a frequency or[off] to disable automatic updates.
Note the following about automatic updates:
- You can only change the automatic refresh frequency while you are viewing the dashboard.For example, if you disable the auto-refresh setting, it remains enabled for other collaborators viewing the dashboard.
- Published dashboards are automatically refreshed with the latest information every 10 minutes.This setting cannot be customized or disabled.
The web content widget is not automatically refreshed in the dashboard.