A sheet in Smartsheet has four views that give you different ways to see and work with your data.These views help clarify and visualize your projects, allowing you to visualize and work with information related to your projects and processes the way you prefer.
Here's an intro to the topics that follow: How Smartsheet presents different types of information.
Grid view
Grid view iswhen setting up the sheetA standard view of the data displayed inSpreadsheet formatto display.This view is ideal for setting project information and task requirements.But Smartsheet's three other views let you see your data in new ways, visualize timelines, and organize tasks into groups.
Card view,Gantt view,andCalendar viewallows you to view your sheets in a smarter, non-tabular way and work more efficiently.
Card view
Smartsheet's Card View is a visual way to prioritize, communicate, and collaborate on your work.Kanban boardとAgile methodologyI got a hint fromCard view makes information and data easier to understand so you can see the big picture, see if your project is on track, and identify potential planning gaps. (For example, if you set a task lane for each person in charge, you can see at a glance which person in charge has the most tasks.)
Using card view,By single-select drop-down list or contact list, tasks, work items, or ideas into groups.For example, you can move items from one group to another by dragging the card from one lane to the next, from 'not done' to 'done', or from assignee to assignee. .i.e.The same editing that changes the selection list in grid view can be done visually by dragging and dropping cards.
With this feature, Card View enhances communication and collaboration between teams, allowing you to review, share and execute projects in a more visual way.
Gantt view
Gantt viewis a feature that visually displays the timeline of your work.This view replaces the traditionalWaterfall project management, but can be used when you want to visually represent the relationship between schedules and tasks.
Here we are following the Card View in order of topic in the Smartsheet help article,Gantt view is the most powerful and popular view in Smartsheet.
Display tasks on sheets and reports in a Gantt chart as bars on the timeline.This gives you not only the start and end dates of your project's events, but alsoCheck the image of the periodcan.To set this view, the sheet must contain start and end dates. (To be exacttwo date type columnsso,not be a column expressionis a condition.You can use reports to get around this limitation, but it's a bit advanced and will be covered another time. )
Calendar view
Calendar viewdisplays your work on an interactive, easily customizable calendar.Also change this view to Google Calendar-Ya Outlook,Apple CalendarIt can also be published or overlaid on your iCal.
Like other sheet views in Smartsheet, the calendar view is driven by the sheet's column type.To create a calendar,at least one date columnmust be prepared.Specifying both the start date and finish date of a task allows you to see a more comprehensive date range. (Information can also be displayed using the Gantt view and the date data created by the Tokonarari column formula.)
Setting up a calendar view allows you to visualize your project's schedule and see the start dates, finish dates, or overall durations of various tasks at once.
I recommend using it mainly for work, for example, overlaying tasks on Smartsheet on Google Calendar, managing appointments in Google Calendar, and managing tasks in Smartsheet.
How non-sheet content displays sheet data
Grid view, card view, Gantt view, and calendar view are four views in the sheet.Although it was an explanation about, Smartsheet aggregates and narrows down the information on the sheet and displays it from an angleレポートとDashboardcontent is available.
For details, please refer to each tutorial, and we will summarize each function.
レポート
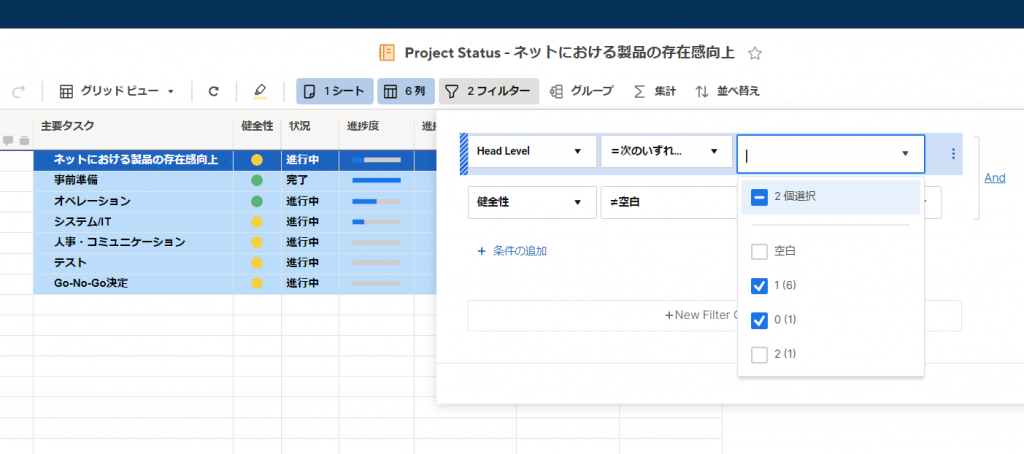
The two functions of the report are primarilyAggregate multiple sheetsand for the second aggregated sheetFilter columns and rowsWhen,Grouping,totalling,SortIt's a feature.
The second function isFunctions similar to Pivot Table in Excelfulfill.Pivot tables in Excel are very powerful, but where Smartsheet reports excel:Narrowing down, grouping, aggregation, etc. are intuitive and easy to understand, and information from multiple sheets can be aggregated.It is a point.
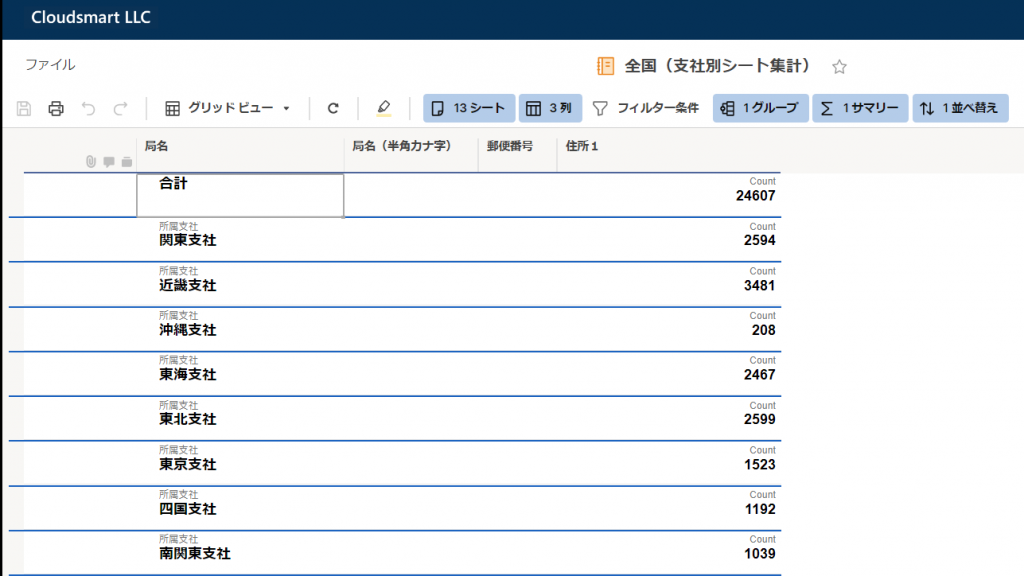
I haven't checked the specific hard limit for the number of sheets in a report, but I've seen something over 300 sheets before and it works. I wouldn't recommend going over 250, but it's possible.In any case, for example, when summarizing the information of branch offices nationwide, for example, Hokkaido, Tohoku, Okinawa, etc., you can create 12 sheets and summarize them as a report without any problems.
By the way, below is an example of managing more than 20,000 post offices in one report by avoiding the Smartsheet row limit (XNUMX rows).
Dashboard
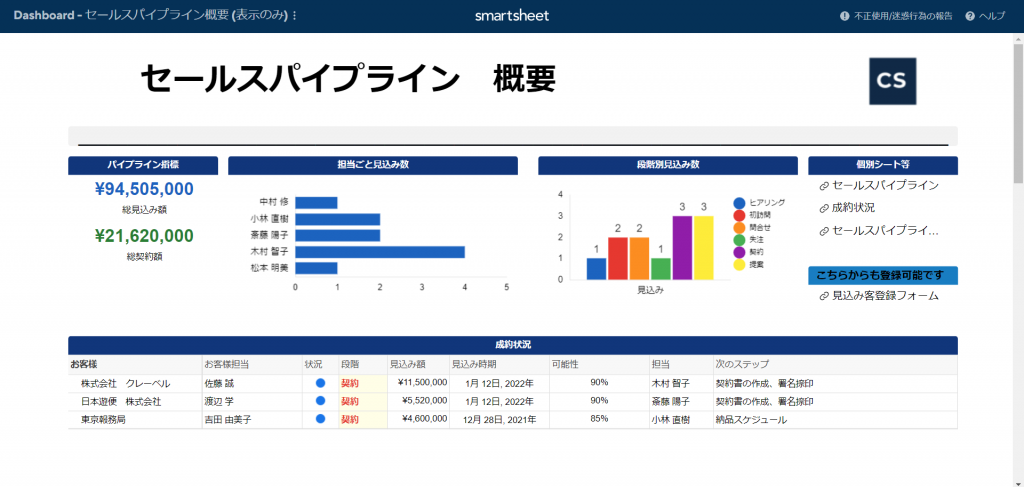
In the dashboard, the information on the sheet can be displayed in several ways, such as images, web content, etc.Ability to freely arrange information on the screen in a portal-like format with other information, including non-Smartsheet informationOffer.
There are several ways of showingmetricsThe widget displays key data on the sheet, andGraphdisplays the information aggregated and calculated on the sheet in graph format.moreover,publishBy doing so, it is possible to display the sheet itself without sharing the sheet, and even allow any user to edit it.
Displaying information by rows in a sheet
Edit screen
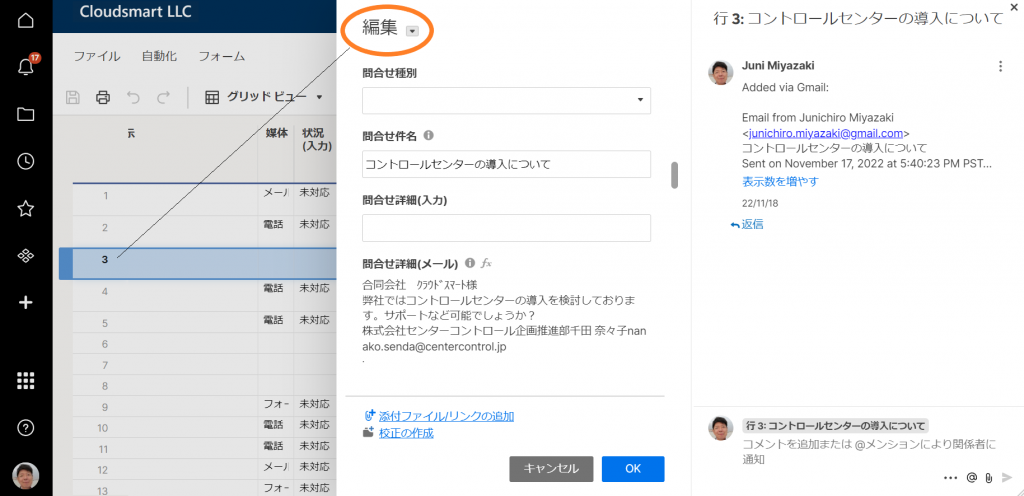
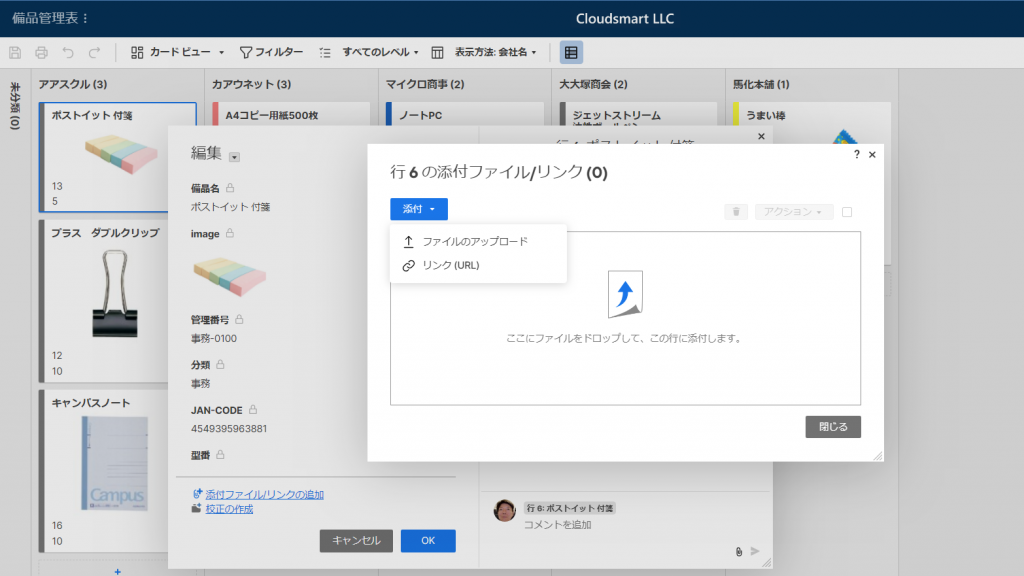
If you are working in a sheet grid view,Hide Columnordozens of columnsAlso, if it is difficult to check the data on the screen, you can select from the row menuEditto view and edit information for all cells in the row.
* SmartsheetMaximum number of columns is XNUMXis.Normally, you wouldn't use this many columns, but you can use more than XNUMX columns if you need to aggregate all the information related to a record unit called a row.In this case, it would be a good idea to select the columns to display in the report so that you can work according to your purpose.
EditYou can also check and edit all the information in a row by using Card View, Gantt View, and Calendar View. In Gantt and Calendar,click barYou can also access the edit menu by
Pre-populating forms with default in-line information
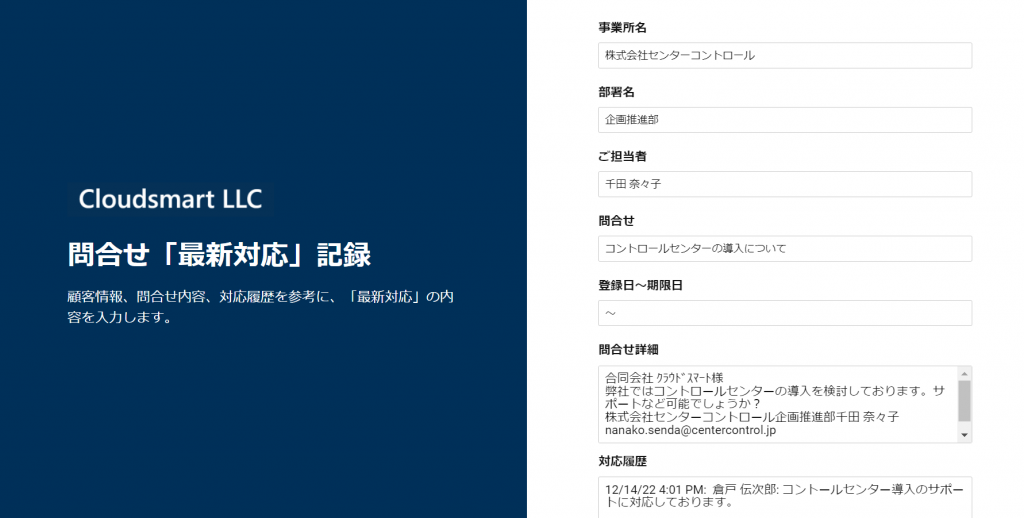
Of the sheetPlace form URL on sheet row celldo it,query stringtaken from another cell in that row on the same form usingPrefilled as defaultIn the same way as the editing screen,Check row information in vertical formThere is also a slightly trickier way to do it.
Regarding this, I would like to introduce only the fact that there is such a method here, and I would like to discuss the specific method in detail on another occasion.